
A transparent read on institutional market structure — free
The BUILDLAB Institutional Indicator is a public, price-only analog to the paid gamma and order-flow tools traders pay monthly for. It plots the levels that actually move index futures — daily VWAP with sigma bands, floor pivots, prior day/week highs and lows, the initial balance, and the opening range — then layers in market internals and a plain-English read of the stack.
No paid feed, no black box, no subscription. Every line is computed from price and volume you can see. Download the full Pine Script v6 source, drop it into TradingView, and make it your own.
The complete .pine file — open it, read it, edit it. Yours to keep.
↓ Download the Pine ScriptEducational and informational only — not financial advice, and not a recommendation to buy or sell any security.
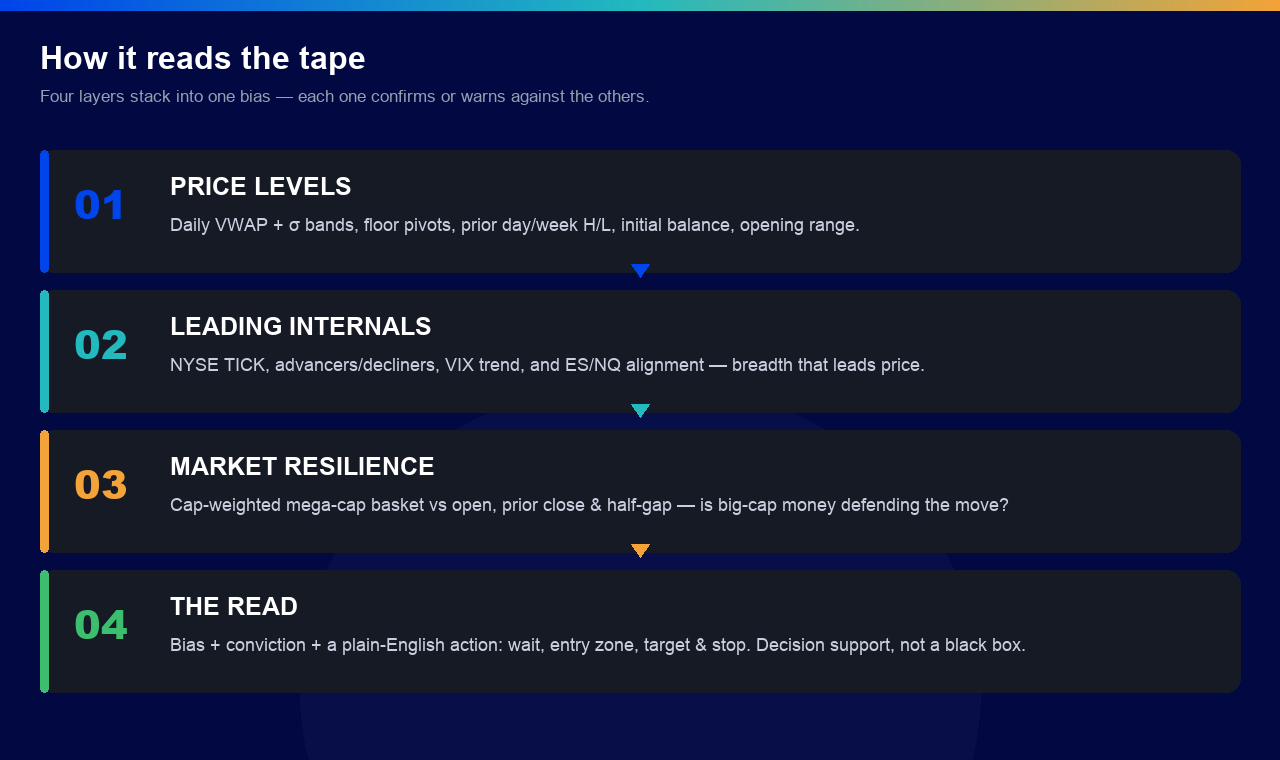
Four layers stack into one bias
Each layer confirms or warns against the others — so you’re never reading a single line in isolation.
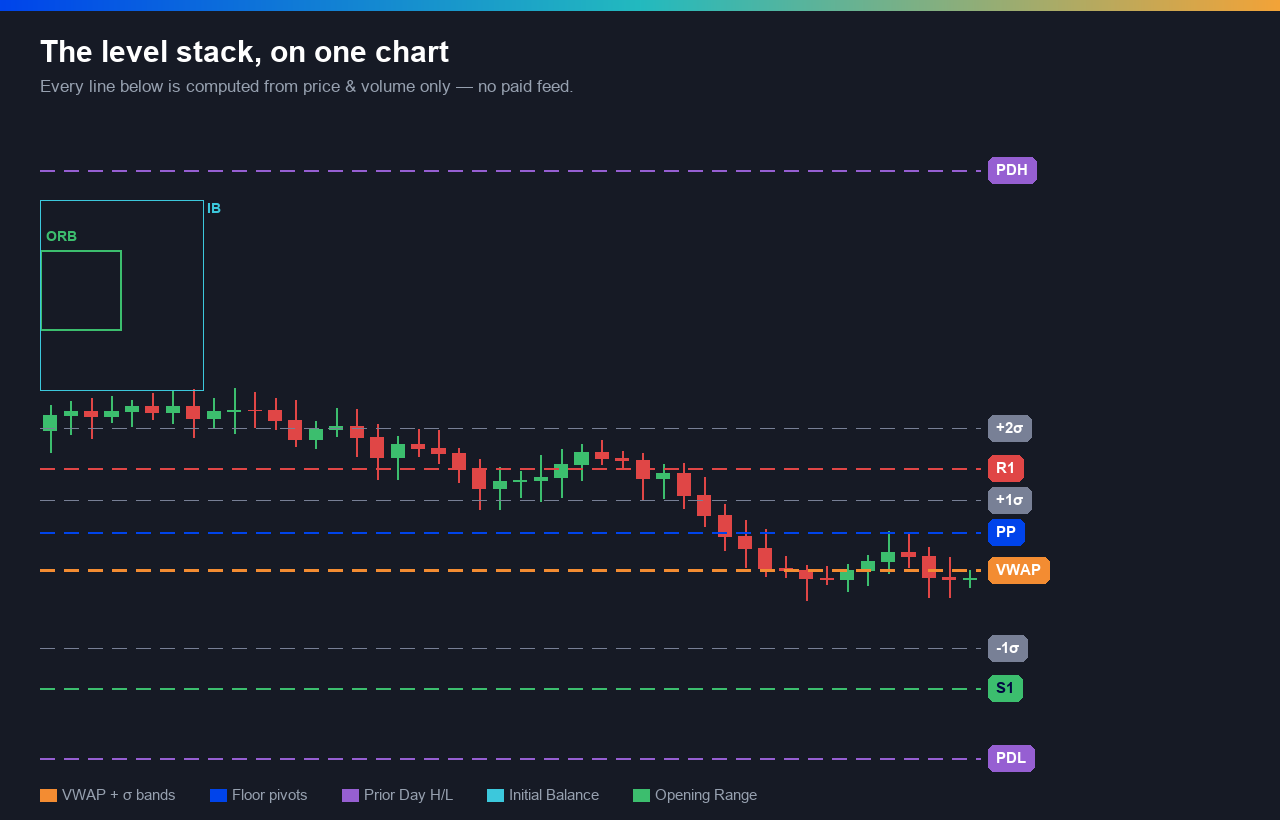
The lines that move index futures
Breadth & internals that lead price
Price levels tell you where. Internals tell you whether the move has support behind it.
NYSE TICK
Net up-ticking vs down-ticking stocks right now — breadth that leads index price.
Advancers / Decliners
How broad the participation is. Positive supports rallies; negative warns a move lacks backing.
VIX trend
Falling volatility = risk-on; rising = risk-off. A simple regime read.
ES / NQ alignment
Whether the partner index agrees. Divergence is your cue to lower conviction.
Market resilience
A cap-weighted mega-cap basket scored vs open, prior close, and the half-gap — is big-cap money defending the move?
Breadth divergence
Price makes a new extreme but breadth doesn’t — a leading warning the move is losing support.
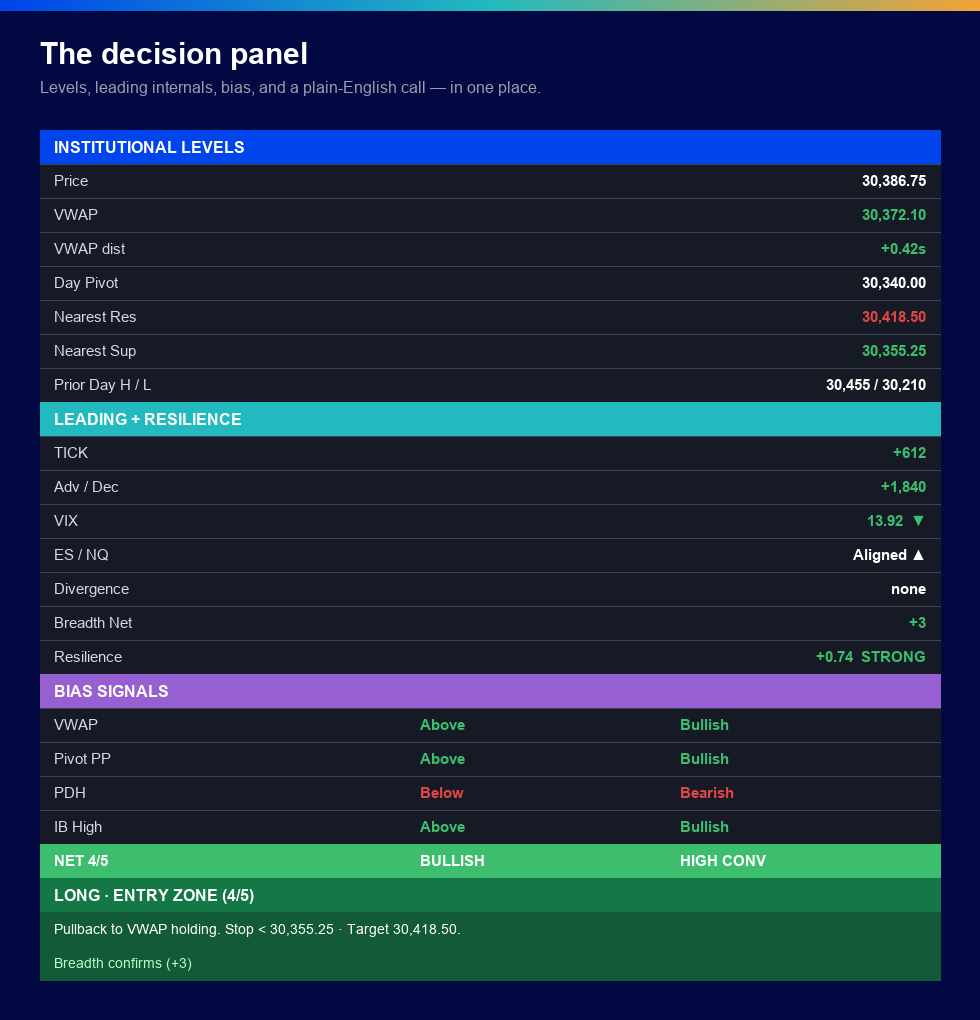
It tells you the read — and when to wait
The merged panel pulls every level, internal, and bias signal into one place, then ends with a plain-English recommendation: wait, entry zone, at resistance, or extended. It counts how many lines align (the conviction), checks whether breadth confirms, and refuses to say “enter” unless price is at a low-risk spot.
On-chart action tags mark the exact prices it references — your dip, your break, your stop, your target — and optional alerts fire when a high-conviction stack or a breadth divergence forms.
Decision support — not a signal to follow blindly. You stay in control of the trade.
- 1Open TradingView and click the Pine Editor tab at the bottom of any chart.
- 2Open the downloaded .pine file in a text editor, select all, and copy it.
- 3Paste it into the Pine Editor (replace the starter template), then click Save and name it.
- 4Click “Add to chart.” Open the settings gear to toggle levels, the breadth layer, and the panel.
- 5Best on index futures (NQ/MNQ, ES/MES) on a 1–15 min intraday timeframe during the regular session.
Want a custom version, or your own indicator built?
This is one example of what BUILDLAB builds. We develop custom TradingView indicators, screeners, dashboards, alerts, and strategy backtests — plus conversions from MQL, ThinkScript, and EasyLanguage to Pine v6.
Disclaimer. The BUILDLAB Institutional Indicator is provided free, for educational and informational purposes only. It is not financial, investment, or trading advice, and is not a recommendation or solicitation to buy or sell any security or derivative. Trading futures and other leveraged products involves substantial risk of loss. Past behavior of any level or signal does not guarantee future results. You are solely responsible for your own trading decisions.
Ready to Work, Let's Chat
Our team of experts is ready to collaborate with you every step of the way, from initial consultation to implementation.