
Know which session you’re in — and where its range is forming.
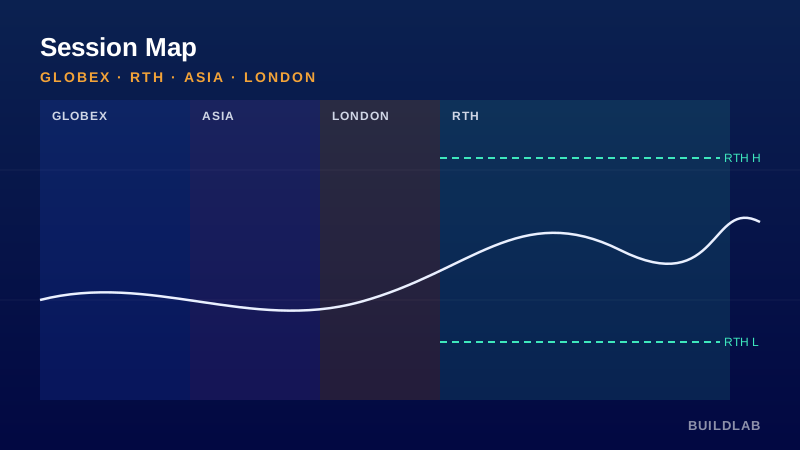
Shades the futures sessions (Globex/overnight, RTH, Asia, London) and tracks the developing regular-hours high and low. Instant context for when liquidity and behavior change between sessions.
Best for: Index & micro futures intraday; session-based and opening-range strategies.
Open it, read it, edit it — it’s yours. © BuildLab Consulting.
How to use it
Set your context
Each shaded band shows which participants are active. Overnight/Globex ranges are thinner and tend to mean-revert; RTH is where real volume and trends develop.
Trade the RTH range
The developing RTH high/low are the day’s working boundaries — breakouts and failed breaks off them are high-information events.
Watch transitions
Volatility and direction frequently shift at the London and New York opens — the shading makes those handoffs obvious.
Settings
- Session windowsEditable time windows for Globex, RTH, Asia and London (in exchange time).
- Exchange timezoneTimezone used to align the session shading.
- Mark RTH High/LowDraw the developing regular-hours high and low as the session builds.
Install
TradingView: open the Pine Editor, paste the .pine source, click Save, then “Add to chart.”
Ready to Work, Let's Chat
Our team of experts is ready to collaborate with you every step of the way, from initial consultation to implementation.