
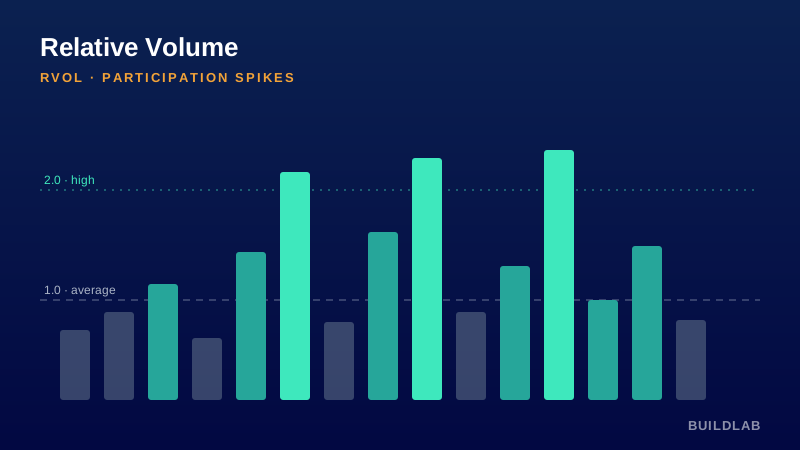
Spot the bars institutions are actually active in.
Compares each bar’s volume to its recent average. RVOL above 1 is above-average participation; spikes past the high threshold flag the bars where real activity — and the moves most worth trusting — are happening.
Best for: All futures; confirming breakouts and filtering low-conviction moves.
Open it, read it, edit it — it’s yours. © BuildLab Consulting.
How to use it
Confirm breakouts
Breakouts on RVOL ≥ your high threshold have real participation behind them; sub-1 RVOL breakouts are prone to fail.
Filter the noise
Down-weight signals that fire on below-average volume — they’re the chop most likely to trap you.
Time the action
RVOL spikes mark the windows of the day worth being most attentive in.
Settings
- Average lengthLookback for the volume average RVOL is measured against.
- High-volume thresholdRVOL level that marks a genuine participation spike (default 2×).
Install
TradingView: open the Pine Editor, paste the .pine source, click Save, then “Add to chart.”
Ready to Work, Let's Chat
Our team of experts is ready to collaborate with you every step of the way, from initial consultation to implementation.