
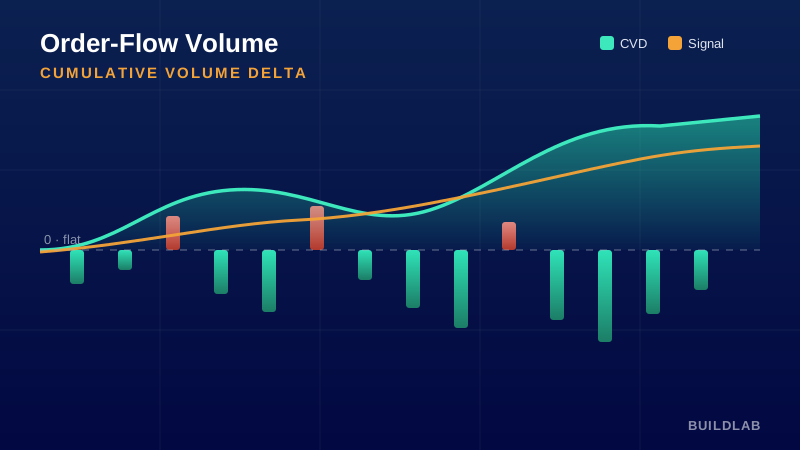
See the net buying vs. selling pressure behind every move.
Cumulative Volume Delta signs each bar’s volume by direction and accumulates it — optionally re-anchored each session — so you can see whether a move is actually backed by order flow. On Tradovate it uses true bid/ask volume (offer − bid) for an exchange-accurate read; on TradingView it signs volume by candle direction.
Best for: Index & micro futures (ES/MES, NQ/MNQ, GC/MGC), 1–15 min intraday.
Open it, read it, edit it — it’s yours. © BuildLab Consulting.
How to use it
Read the pressure
Rising CVD = net buyers in control; falling CVD = net sellers. The slope matters more than the absolute number.
Hunt divergences
Price makes a new high but CVD does not (or vice-versa) → the move isn’t backed by order flow. This is the highest-value signal: it flags exhaustion and likely reversals.
Use the signal MA
CVD crossing above/below its moving average marks a shift in short-term pressure — a confirmation filter for entries.
Anchor to the session
Keep “reset each session” on for day trading so each day starts flat; turn it off for a continuous multi-day swing view.
Settings
- Delta source / True deltaUse bid/ask volume where available (Tradovate), otherwise candle polarity (close vs. open or prior close).
- Reset each sessionRe-anchor the cumulative delta to zero at the start of each trading day for clean intraday reads.
- Signal MA lengthLength of the moving average drawn over CVD to smooth it and flag pressure shifts.
Install
TradingView: open the Pine Editor, paste the .pine source, click Save, then “Add to chart.”
Tradovate: Chart ▸ Indicators ▸ “+” (Add Custom Indicator), paste the .js source, Save, then add it to the chart.
Ready to Work, Let's Chat
Our team of experts is ready to collaborate with you every step of the way, from initial consultation to implementation.