
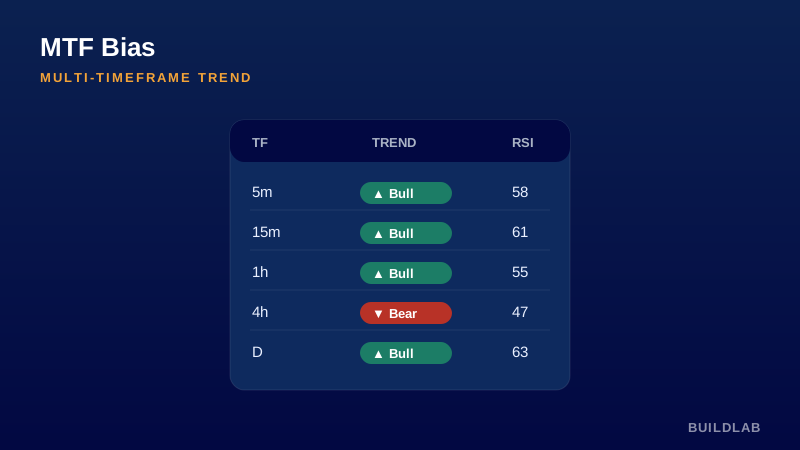
Five timeframes of trend, at a glance.
A compact table showing trend (price vs. EMA) and RSI across five timeframes at once, so you always know whether you’re trading with or against the higher-timeframe tide.
Best for: All futures; trend alignment and confluence filtering.
Open it, read it, edit it — it’s yours. © BuildLab Consulting.
How to use it
Trade with the tide
Take trades in the direction the higher timeframes agree on; when 4h and Daily are bullish, favor longs on the lower frames.
Demand alignment
The cleanest setups are when most/all rows agree. Mixed rows = chop risk — size down or stand aside.
Use RSI for timing
When trend rows align, an RSI pullback on a lower frame is your entry timing within that bias.
Settings
- EMA / RSI lengthsLengths used for the trend (EMA) and momentum (RSI) reads.
- Timeframes 1–5The five timeframes shown — defaults 5m, 15m, 1h, 4h, Daily.
- Table positionWhere the dashboard sits on the chart.
Install
TradingView: open the Pine Editor, paste the .pine source, click Save, then “Add to chart.”
Ready to Work, Let's Chat
Our team of experts is ready to collaborate with you every step of the way, from initial consultation to implementation.