
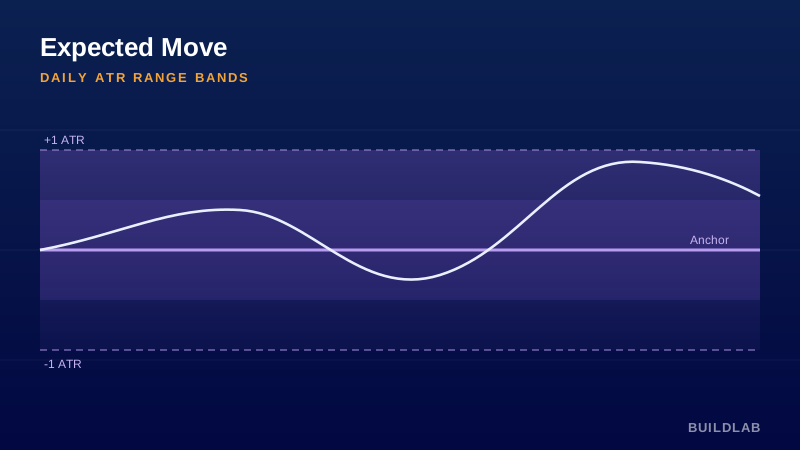
Is today’s move normal, or already extended?
Projects the day’s statistically expected range as ATR-based bands around the session anchor (open or prior settlement). A fast read on whether price is inside a normal day’s range or stretched.
Best for: Index & micro futures; intraday mean-reversion and target-setting.
Open it, read it, edit it — it’s yours. © BuildLab Consulting.
How to use it
Gauge extension
Inside the inner band = quiet; tagging the outer (±1 ATR) band means the day is already near a full expected range — fade or take profit.
Set realistic targets
Use the bands as objective profit targets instead of guessing how far a move “should” go.
Spot trend days
Closing beyond the outer band signals an above-average, trending day — switch from fading to trend-following.
Settings
- Daily ATR lengthLookback for the daily Average True Range that sizes the bands.
- AnchorBuild the bands from today’s open or the prior settlement.
- Band multipliersInner/outer band size as multiples of daily ATR (default 0.5× and 1×).
Install
TradingView: open the Pine Editor, paste the .pine source, click Save, then “Add to chart.”
Ready to Work, Let's Chat
Our team of experts is ready to collaborate with you every step of the way, from initial consultation to implementation.